Since versions 7.18 of RouterOS I’ve been having trouble with the LTE connection on Mikrotik wAP LTE kit (Amazon) with R11e-LTE6 modem (firmware V038) where it would randomly go into an infinite loop of lte1 link up and lte1 link down every few days. Update (November 2025): this appears to have been fixed in one of the recent Router OS 7.20 versions.
So I configured remote logging to capture the events that happen in the lead up to the issue since the logs on the disk get rotated very quickly due to the shear volume of the messages. Turns out that setting up the remote logging in RouterOS is way more involved so I wrote this guide to note some of the undocumented behaviors and features.
Logging in RouterOS
Logging can be configured under “System → Logging” where you define Rules about which log events (topics) trigger which log Actions:
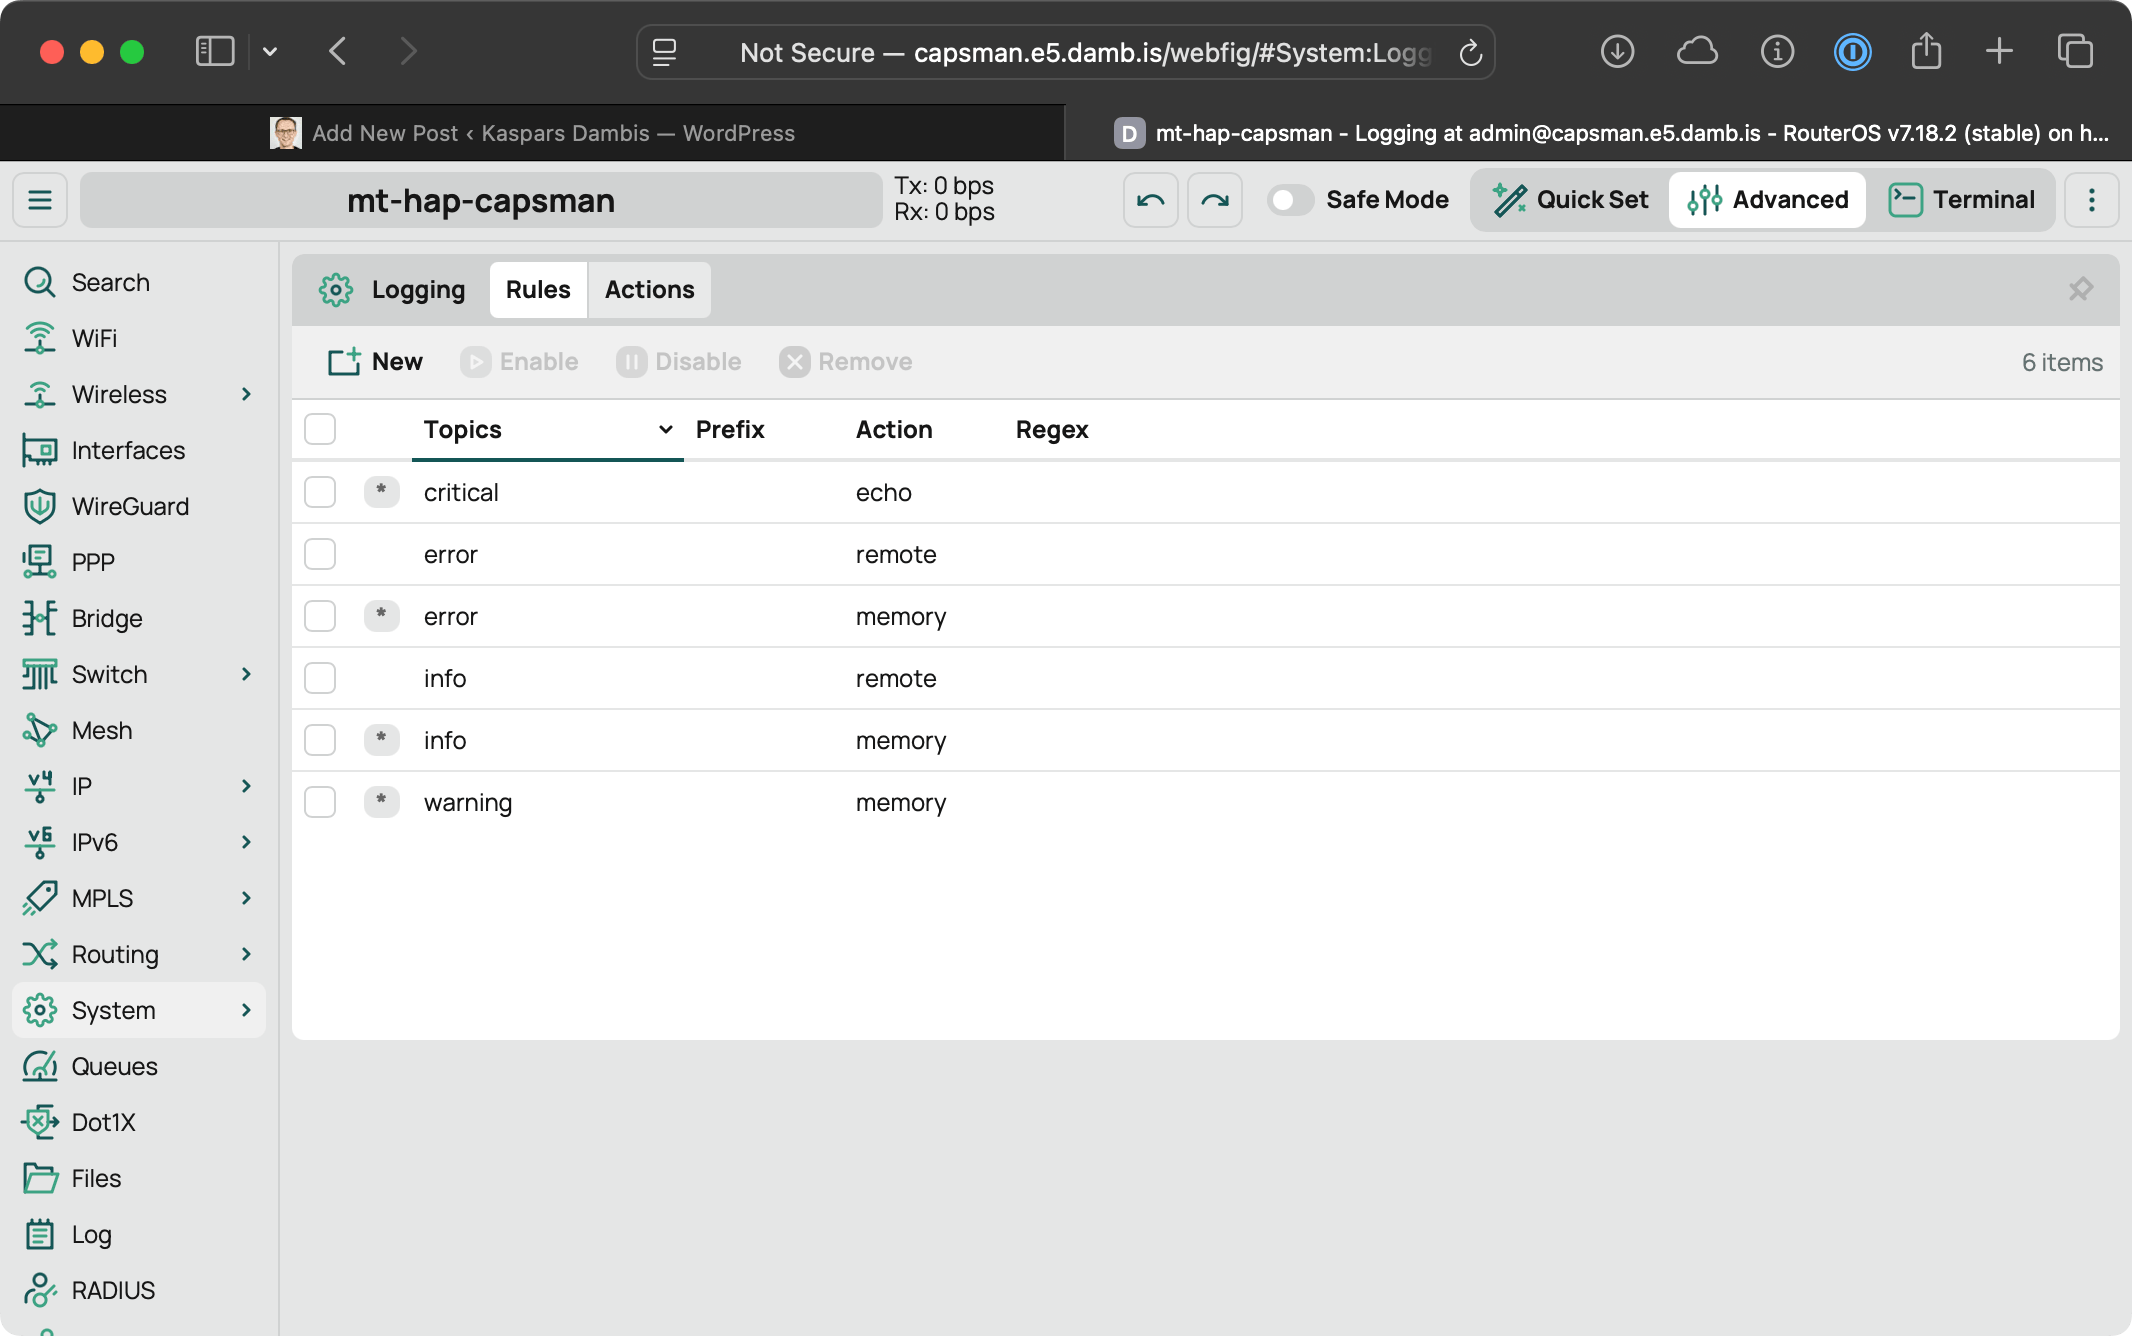
Most of these rules are pre-configured by default.
Each rule has two parts:
- Topics which is either log severity —
critical,error,warning,info,debugor a specific component targeting —lte,firewall, etc. - Action for where the log entry is sent —
echofor terminal output,memoryfor RAM,diskfor writing to flash,emailfor email andremotefor what we’re after.
And here is the individual rule configuration:

Important: the topic selection is ANDed together — specifying multiple topics will make the rule apply only if the log event belongs to all of the selected topics!
The Regex filtering can be applied to the log string contents to narrow down the selected events even further. Each rule can have only one action!
Funny how RouterOS is glass half-empty with the “NOT INVALID” flag.
Remote Log Action
We need to configure the remote log action which is enabled by default but without the remote address defined. Here are the available configuration options:
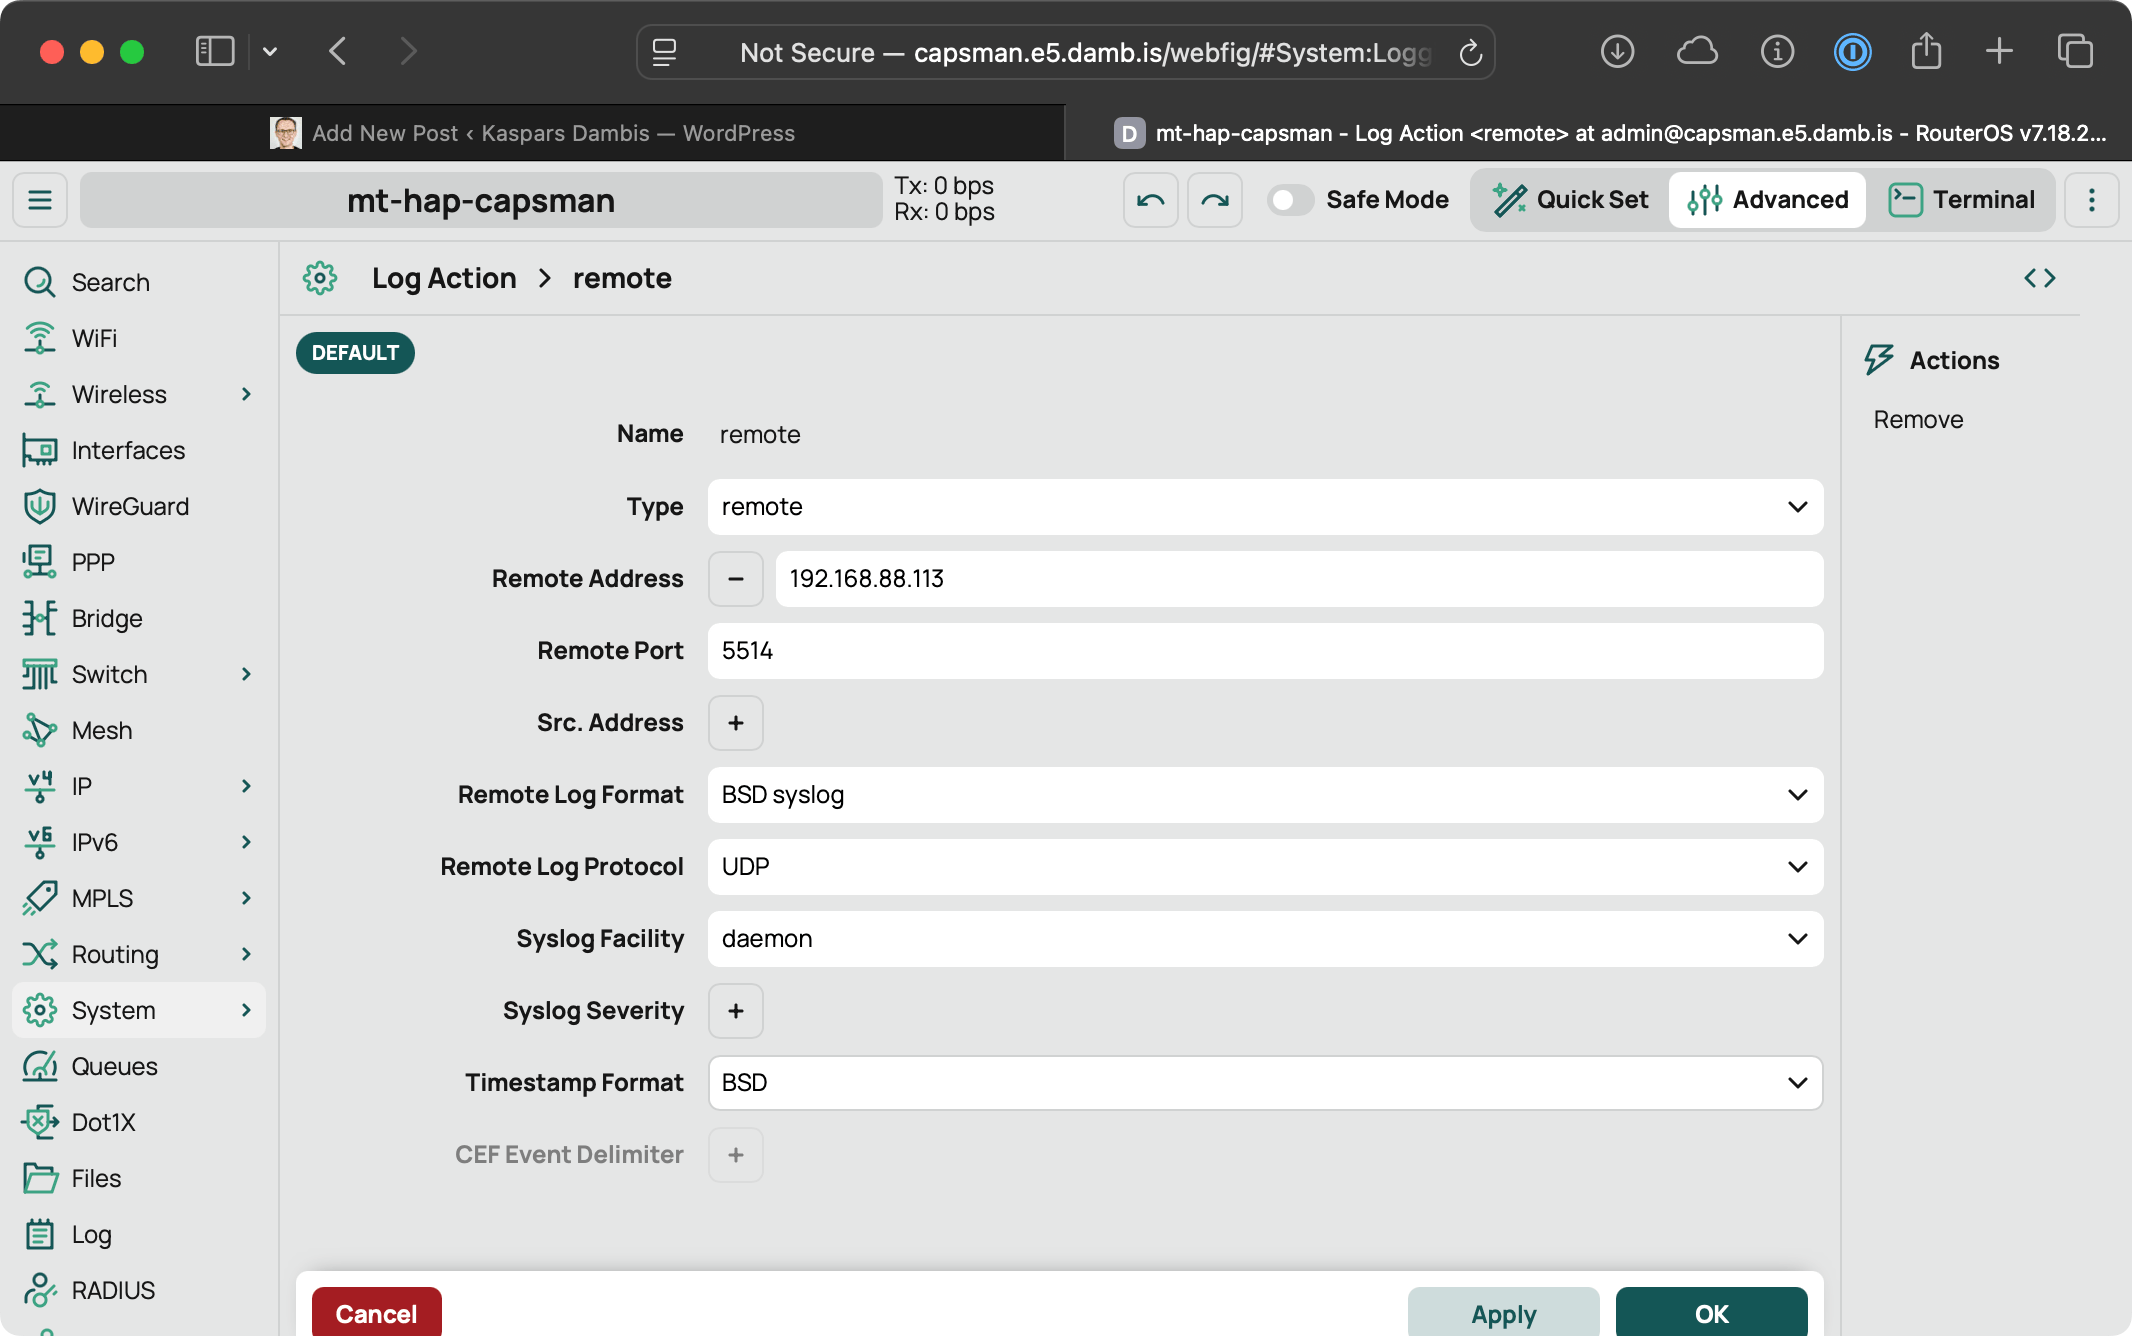
It supports three remote log formats:
- default — a custom Mikrotik format that matches the RouterOS log strings.
- BSD syslog — which is actually the legacy RFC 3164 standard (replaced with RFC 5424).
- CEF or Common Event Format with pipe-delimited fields with syslog prefix.
which can be transported over UDP or TCP with additional customization for the timestamp format:
- BSD (example:
Mar 16 17:43:09) - ISO8610 (example:
2025-03-16T17:48:26.0000+0200)
Here are examples of a log messages in each format:
Default Format
Note how it doesn’t include the event timestamp:
system,info log action changed by macintosh-intel-mac-os-x/web:admin@10.200.200.16 (/system logging action set "" remote=192.168.88.113 remote-log-format=default remote-port=9514 remote-protocol=udp src-address=0.0.0.0 syslog-facility=daemon syslog-severity=auto syslog-time-format=bsd-syslog target=remote)BSD syslog Format
Note the priority prefix <30> follow by the timestamp in the header.
<30>Mar 16 17:43:09 mt-hap-capsman log action changed by macintosh-intel-mac-os-x/web:admin@10.200.200.16 (/system logging action set "" remote=192.168.88.113 remote-log-format=syslog remote-port=9514 remote-protocol=udp src-address=0.0.0.0 syslog-facility=daemon syslog-severity=auto syslog-time-format=bsd-syslog target=remote)BSD syslog with ISO8610 timestamp:
<30>2025-03-16T17:48:26.0000+0200 mt-hap-capsman log action changed by macintosh-intel-mac-os-x/web:admin@10.200.200.16 (/system logging action set "" remote=192.168.88.113 remote-log-format=syslog remote-port=9514 remote-protocol=udp src-address=0.0.0.0 syslog-facility=daemon syslog-severity=auto syslog-time-format=iso8601 target=remote)CEF Format
Note how this appears to be the most verbose and include additional information about the system config:
Mar 16 17:43:38 mt-hap-capsman CEF:0|MikroTik|hAP ac^2|7.18.2 (stable)|10|system,info|Low|dvchost=mt-hap-capsman dvc=192.168.88.2 msg=log action changed by macintosh-intel-mac-os-x/web:admin@10.200.200.16 (/system logging action set "" cef-event-delimiter\="" remote\=192.168.88.113 remote-log-format\=cef remote-port\=9514 remote-protocol\=udp src-address\=0.0.0.0 syslog-facility\=daemon syslog-severity\=auto syslog-time-format\=bsd-syslog target\=remote)Syslog Server with Grafana Promtail and Loki

Here is a minimal docker-compose.yml for a Grafana Promtail listening on port 5514 for UDP traffic (and labeling the logs by hostname and severity) and pushing them to a Grafana Loki server on port 3100 for storage:
services:
  loki:
    image: grafana/loki:3.6
    ports:
      - 3100:3100

  promtail:
    image: grafana/promtail:3.4.2
    ports:
      - 5514:5514/udp
    volumes:
      - etc-promtail:/etc/promtail
    command: -config.file=/etc/promtail/promtail-config.yml

volumes:
  etc-promtail:
and the promtail-config.yml contents:
server:
  disable: true

positions:
  filename: /tmp/positions.yaml

clients:
  - url: http://loki:3100/loki/api/v1/push

scrape_configs:
  - job_name: syslog
    syslog:
      listen_address: 0.0.0.0:5514
      listen_protocol: udp
      syslog_format: rfc3164
      labels:
        job: syslog
    relabel_configs:
      - source_labels: ['__syslog_message_hostname']
        target_label: host
      - source_labels: ['__syslog_message_hostname']
        target_label: instance
      - source_labels: ['__syslog_message_app_name']
        target_label: application
      - source_labels: ['__syslog_message_severity']
        target_label: level
Although Grafana Promtail is being replaced with Grafana Alloy, I found the new configuration format much harder to work with so I’m sticking with Promtail as something well tested and reliable.
Importantly, we’re using Promtail here only for labeling the syslog messages by their hostname, message context and severity which isn’t supported by the loki built-in syslog integration.
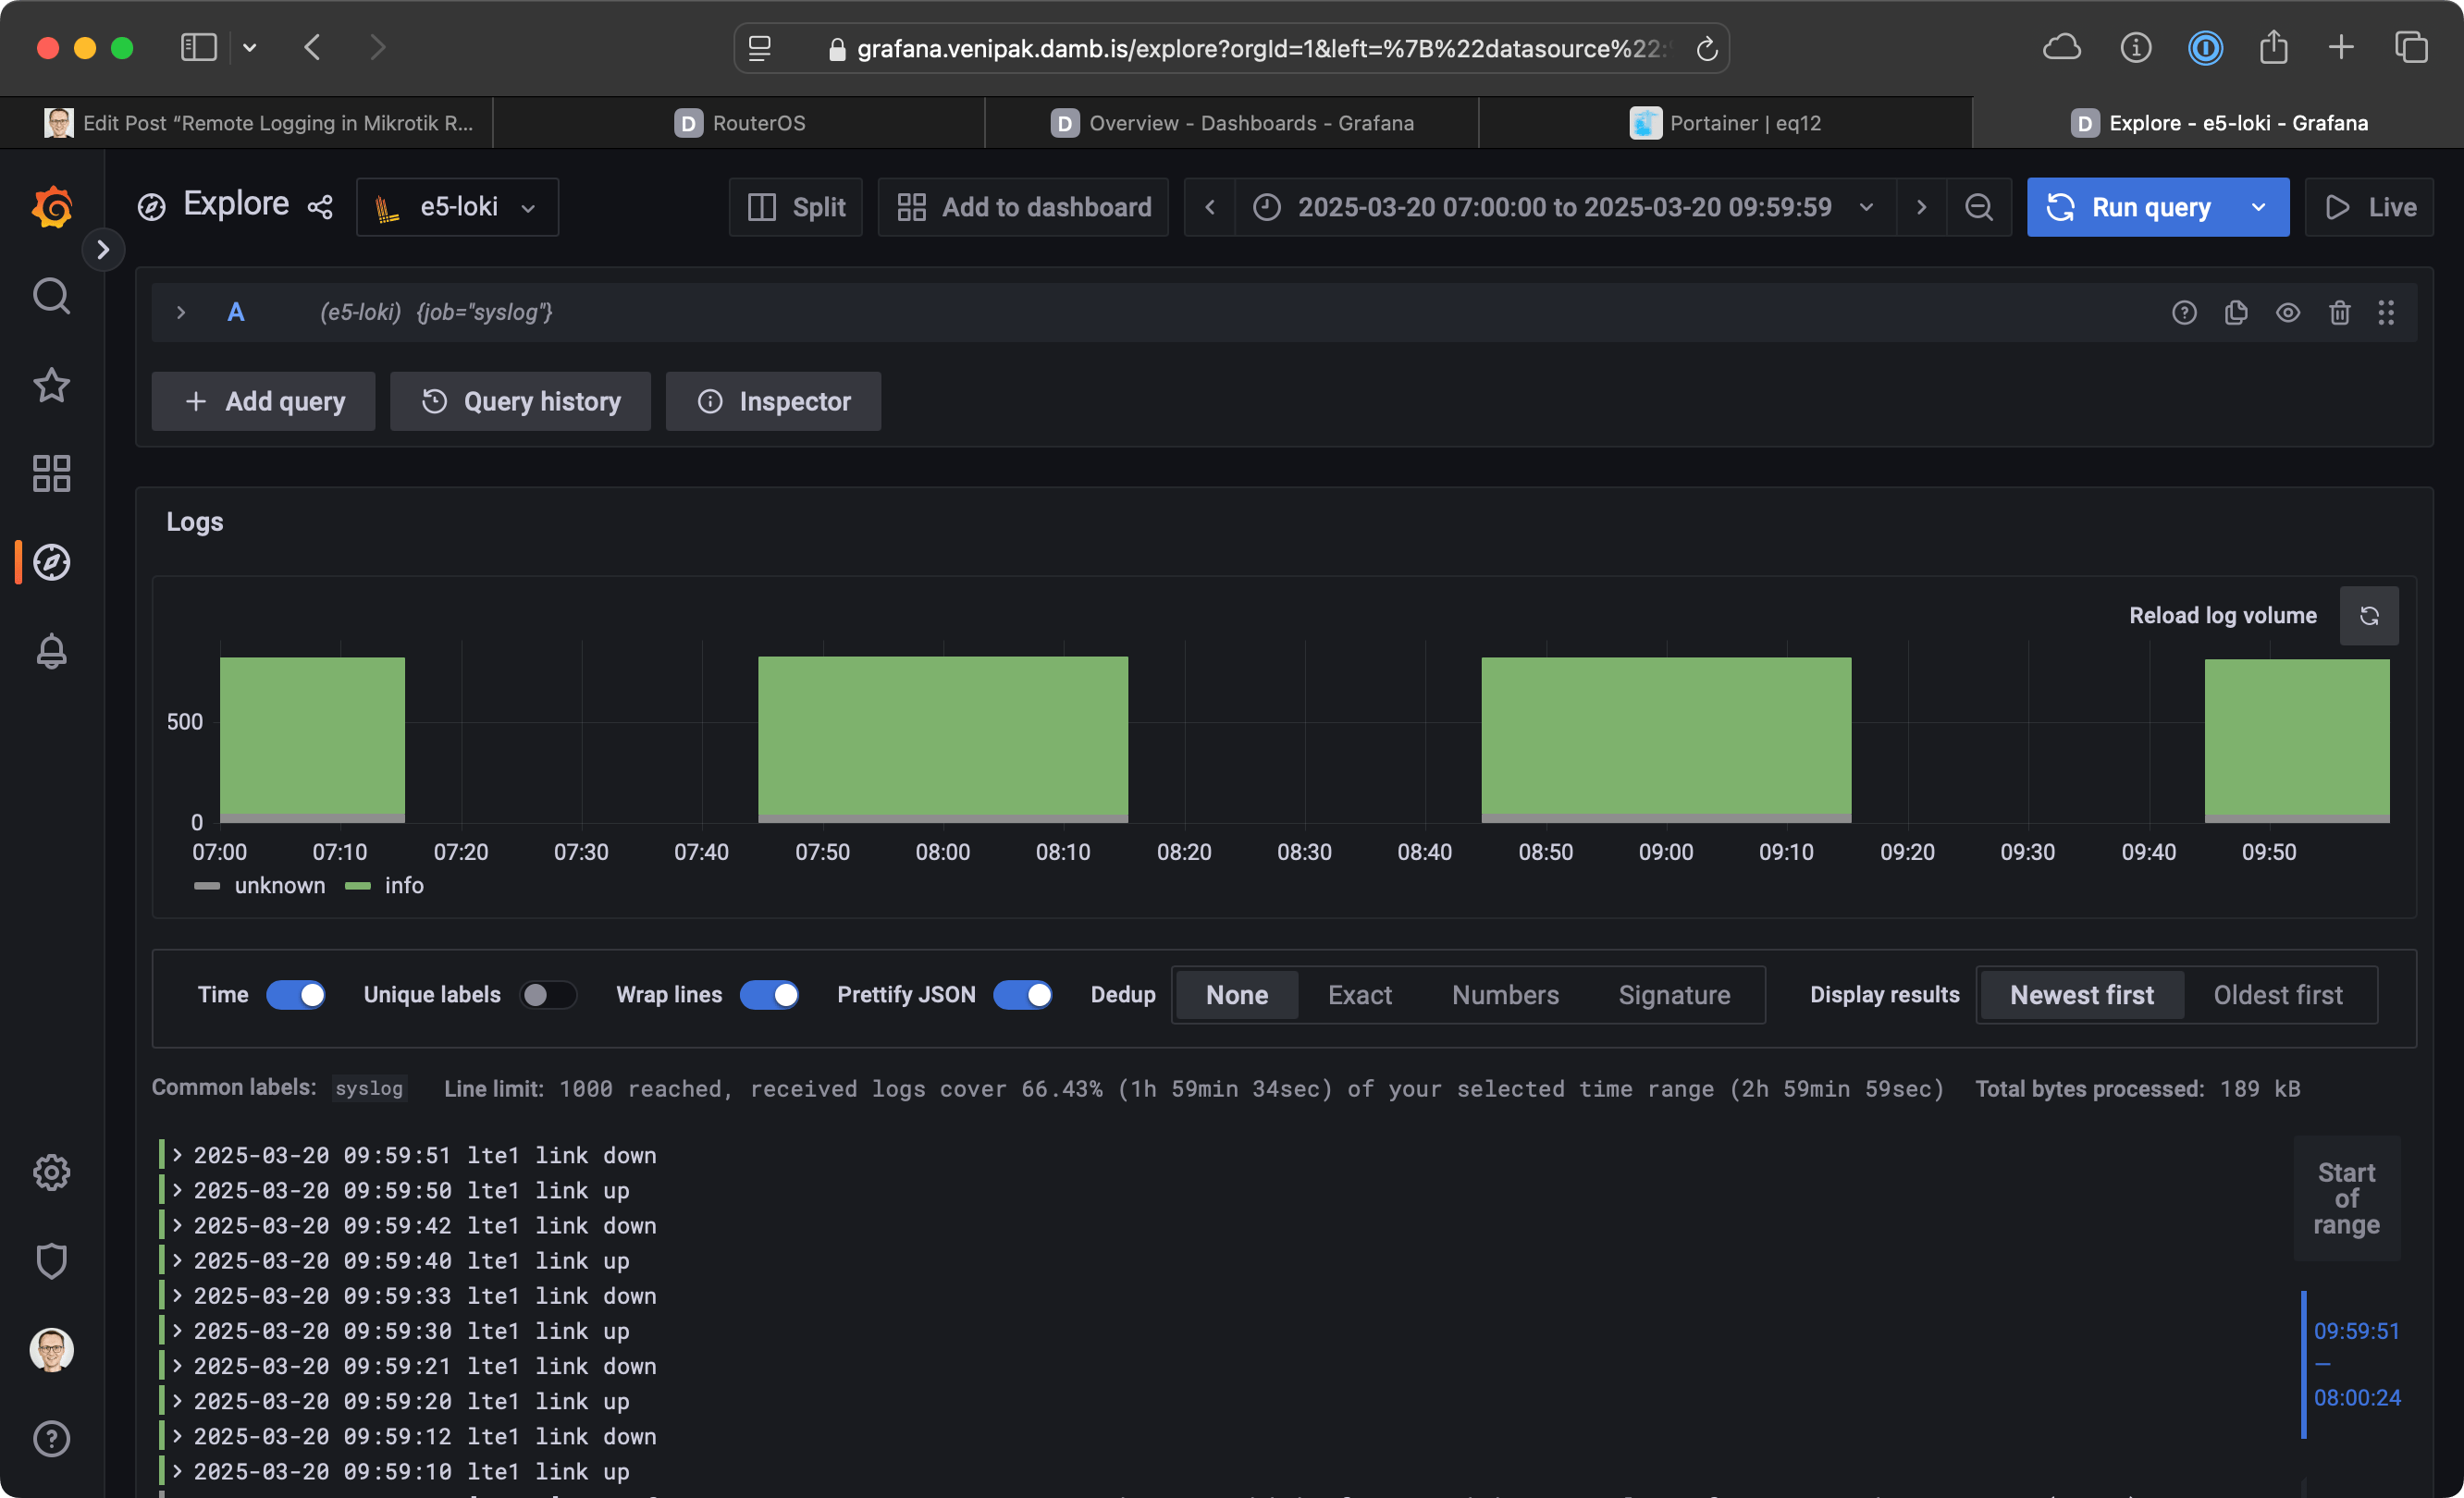
Logs in Grafana
You can then add Loki as a data source in Grafana and display the logs as needed:
Debug Syslog UDP and TCP Traffic
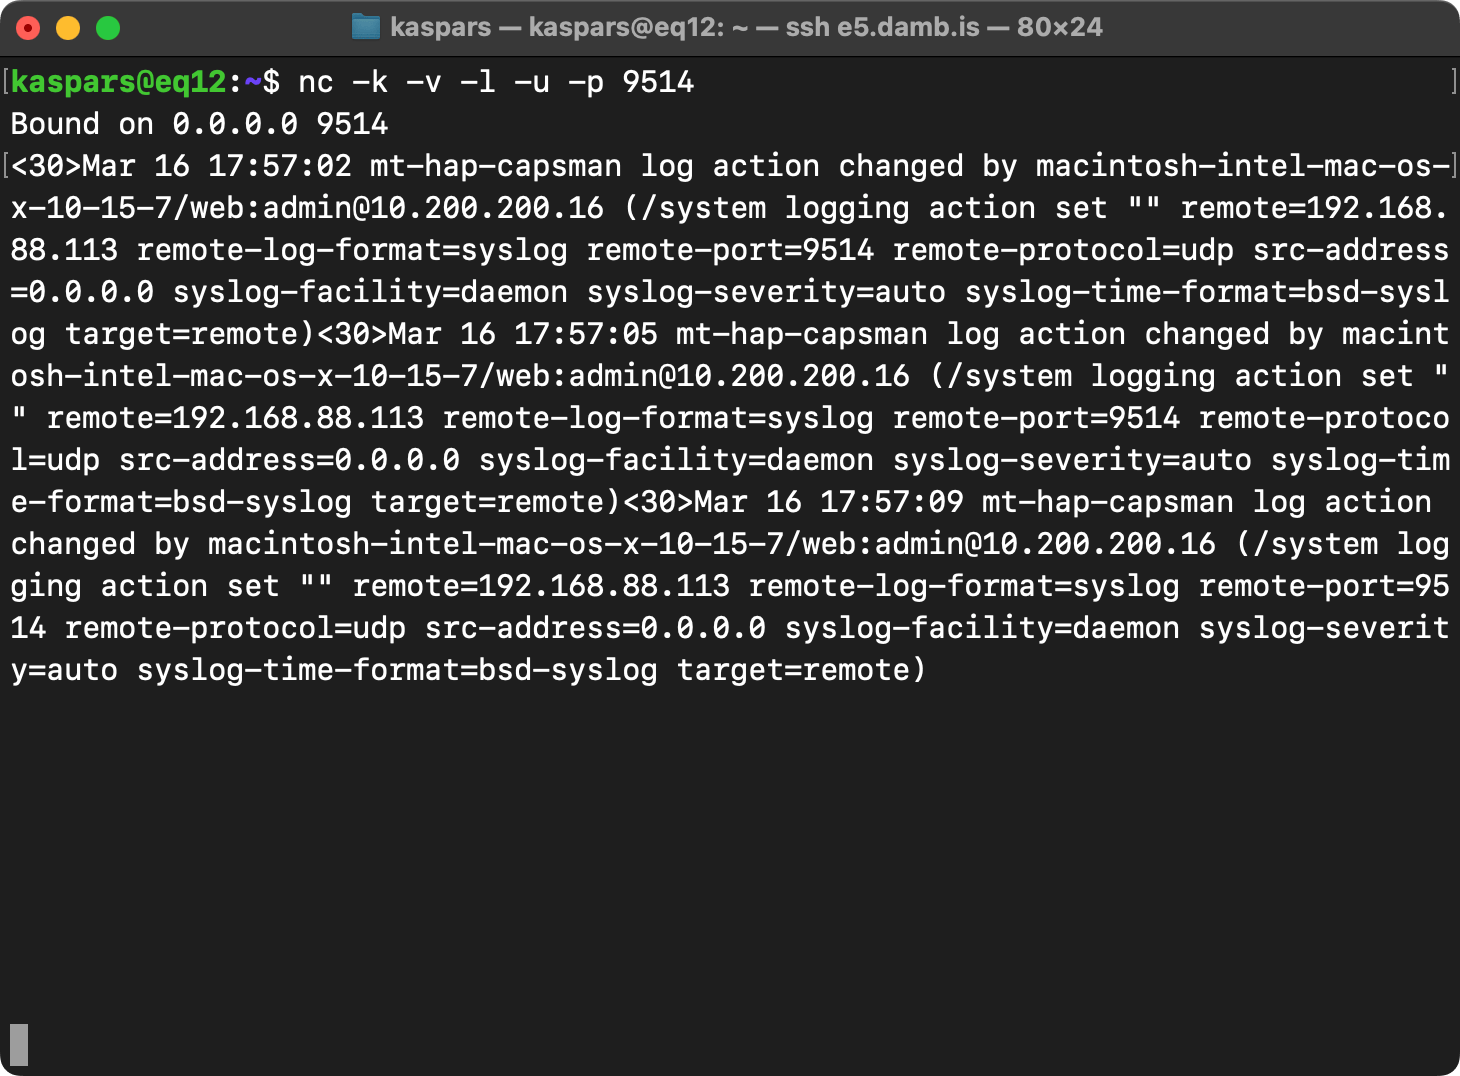
You can use netcat (nc) to capture the messages sent by RouterOS on the remote host:
nc -k -v -l -p 9514to capture TCP traffic on port 9514.nc -k -v -l -u -p 5514to capture UDP traffic on port 5514.
where:
-kkeeps the connection alive and listening,-vprints verbose information,-lmakes it listen for incoming connections instead of making one,-pfor port to listen on.-ufor UDP traffic (defaults to TCP without the flag).
Or tcpdump to capture both TCP and UDP traffic in a PCAP file for viewing in Wireshark:
tcpdump -i any port 6514 -w dump-tcp.pcap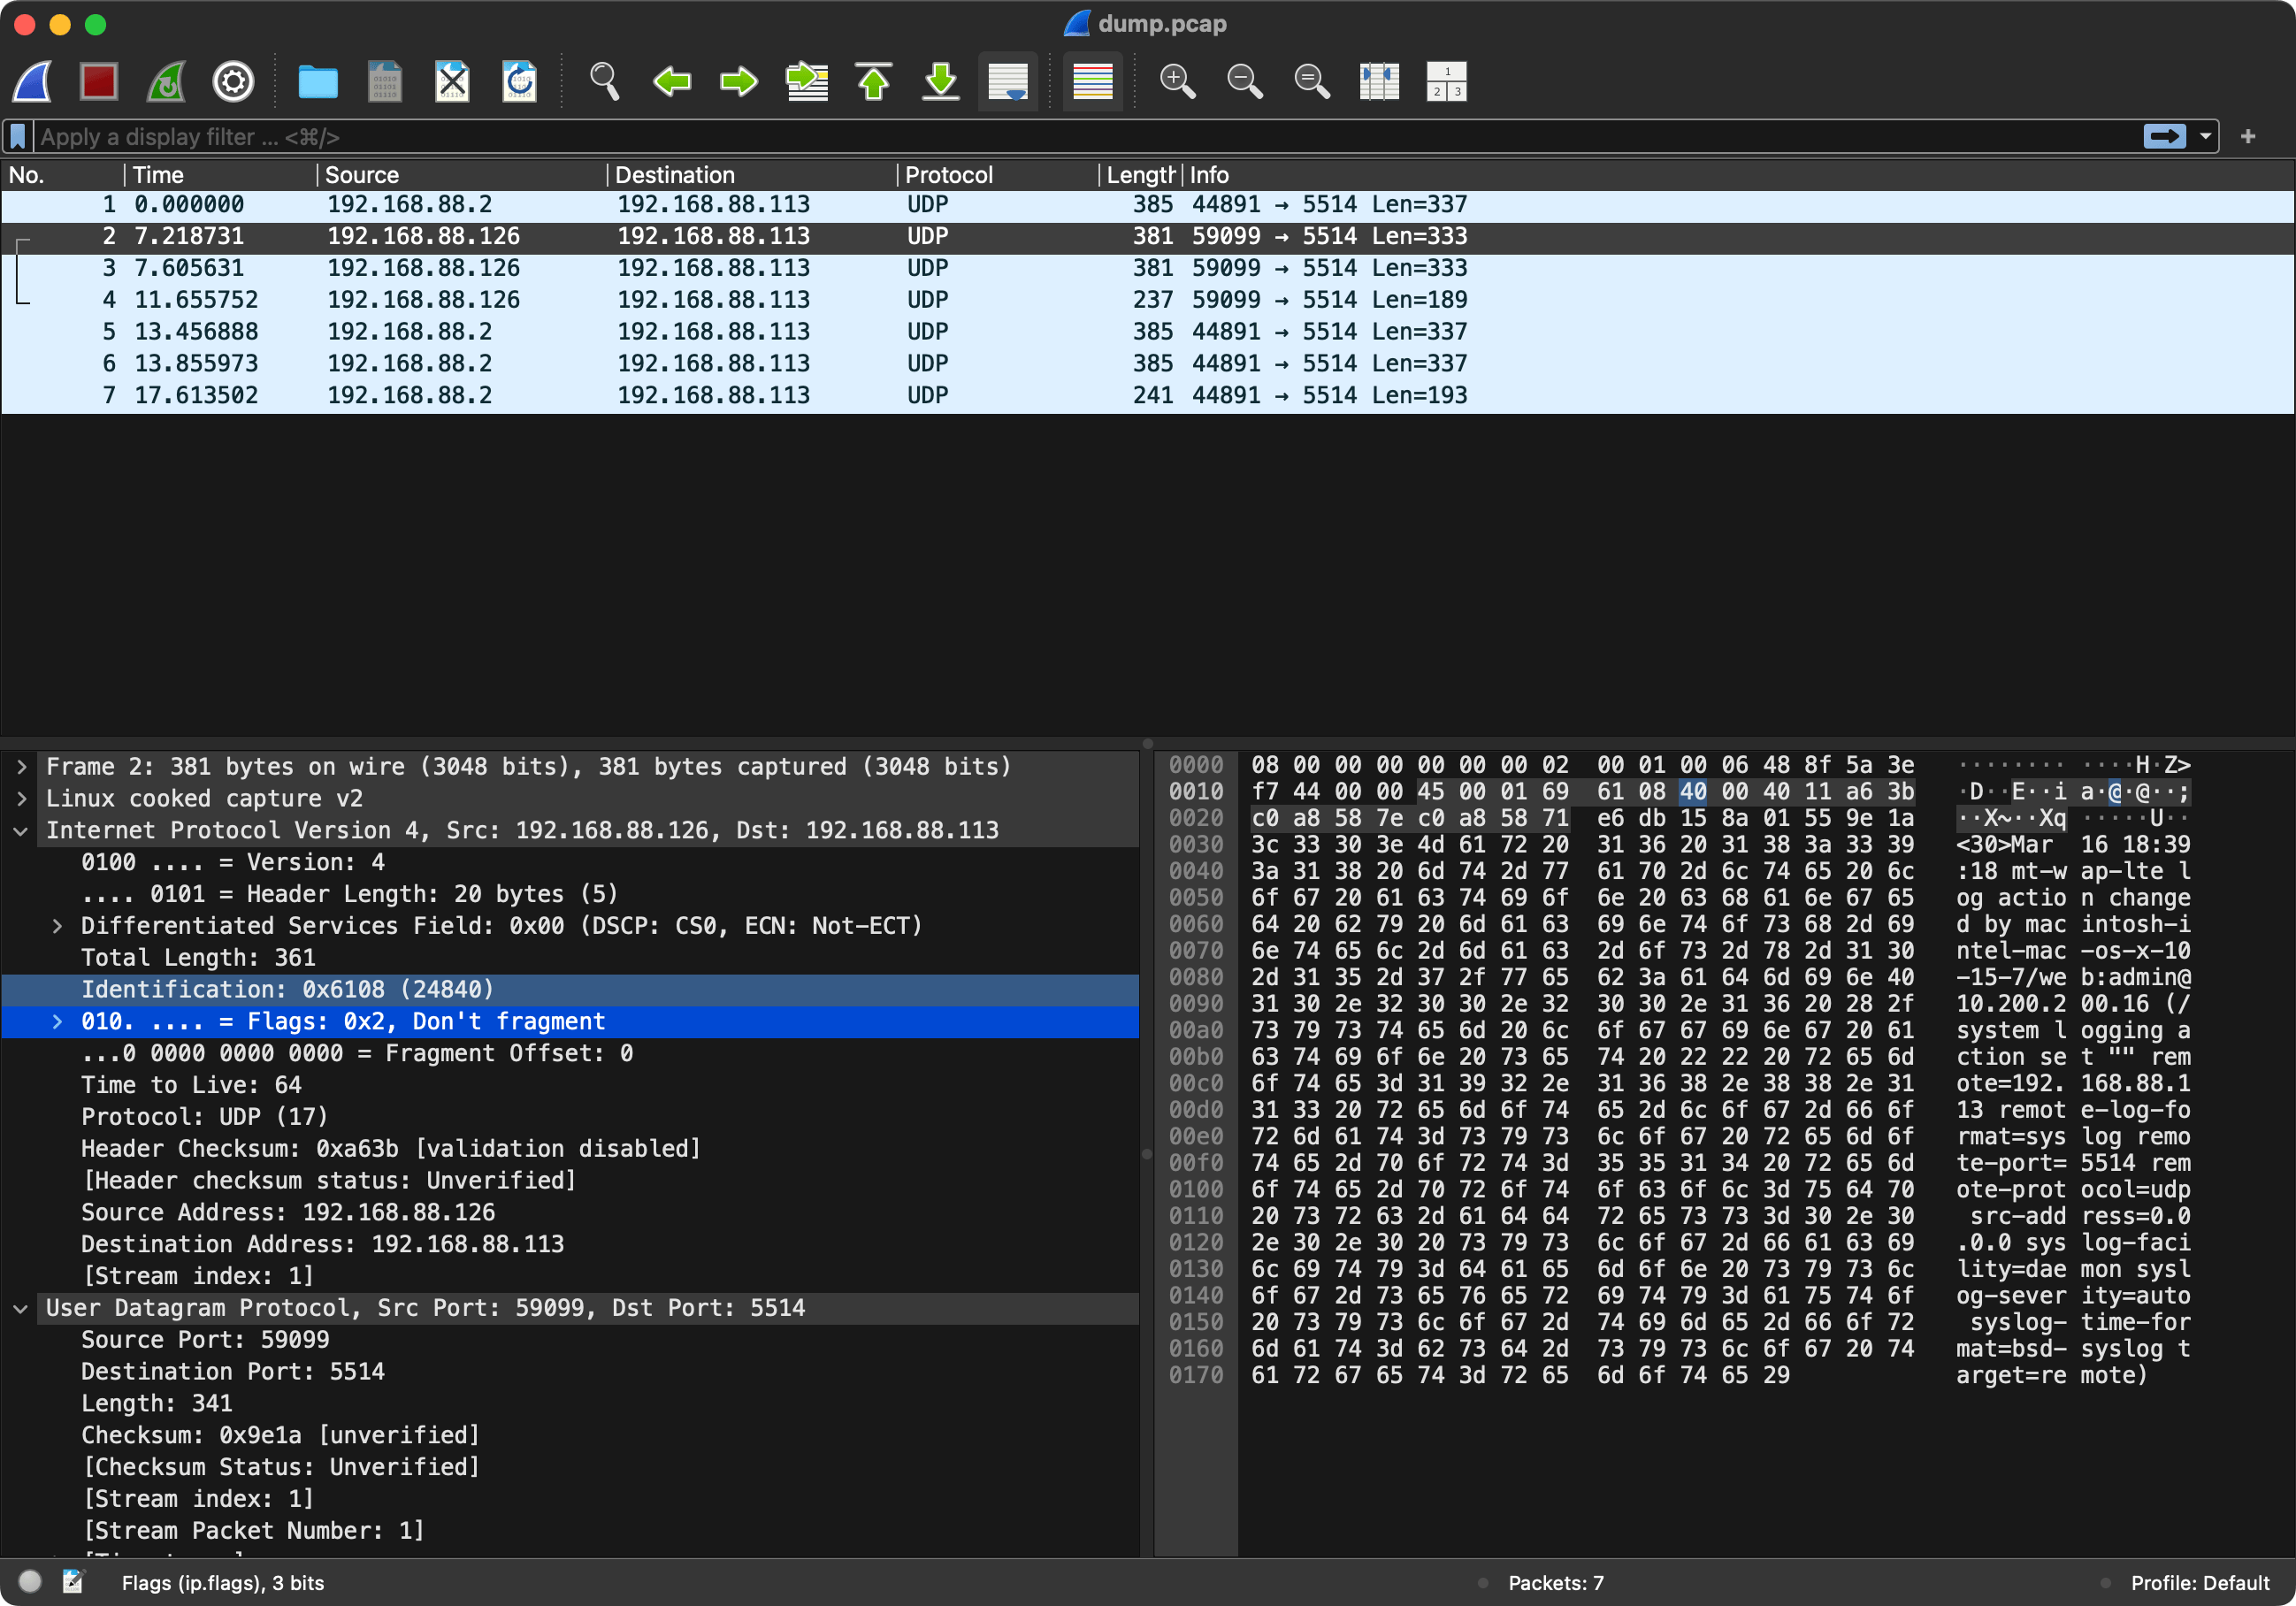
Worth calling out – if you use the BSD / RFC3164 format from RouterOS, you *LOSE* the “topics”, which is highly undesirable. Without the ROS “topics” you can’t tell if the message severity is critical/error/warning/info/debug, and you don’t know what “facility” within the device generated the message – like “system,” “dhcp,” etc.) See the ROS manual for the giant list of potential “facilities” (which they change seemingly at whim): https://help.mikrotik.com/docs/spaces/ROS/pages/328094/Log#Log-TopicsusedbyvariousRouterOSfacilities
CEF would be the best format to get all the detail, but it doesn’t exist on older releases of ROS7 and not at all on ROS6, either, plus CEF log entries are sometimes too verbose.
The “best” way to ingest is as “raw” data, using ROS’s “default” format, IMO (not sure how to do this in Promtail, but it’s possible with Alloy).
That’s a great point, thanks for sharing!